Statistics
Wishlist analytics at a glance. Total items, active wishlists, most-wishlisted products, and 30-day activity.
The Statistics tab gives you a quick overview of wishlist activity across your store. No third-party analytics needed — the data is right there in your FluentCart settings.
Dashboard
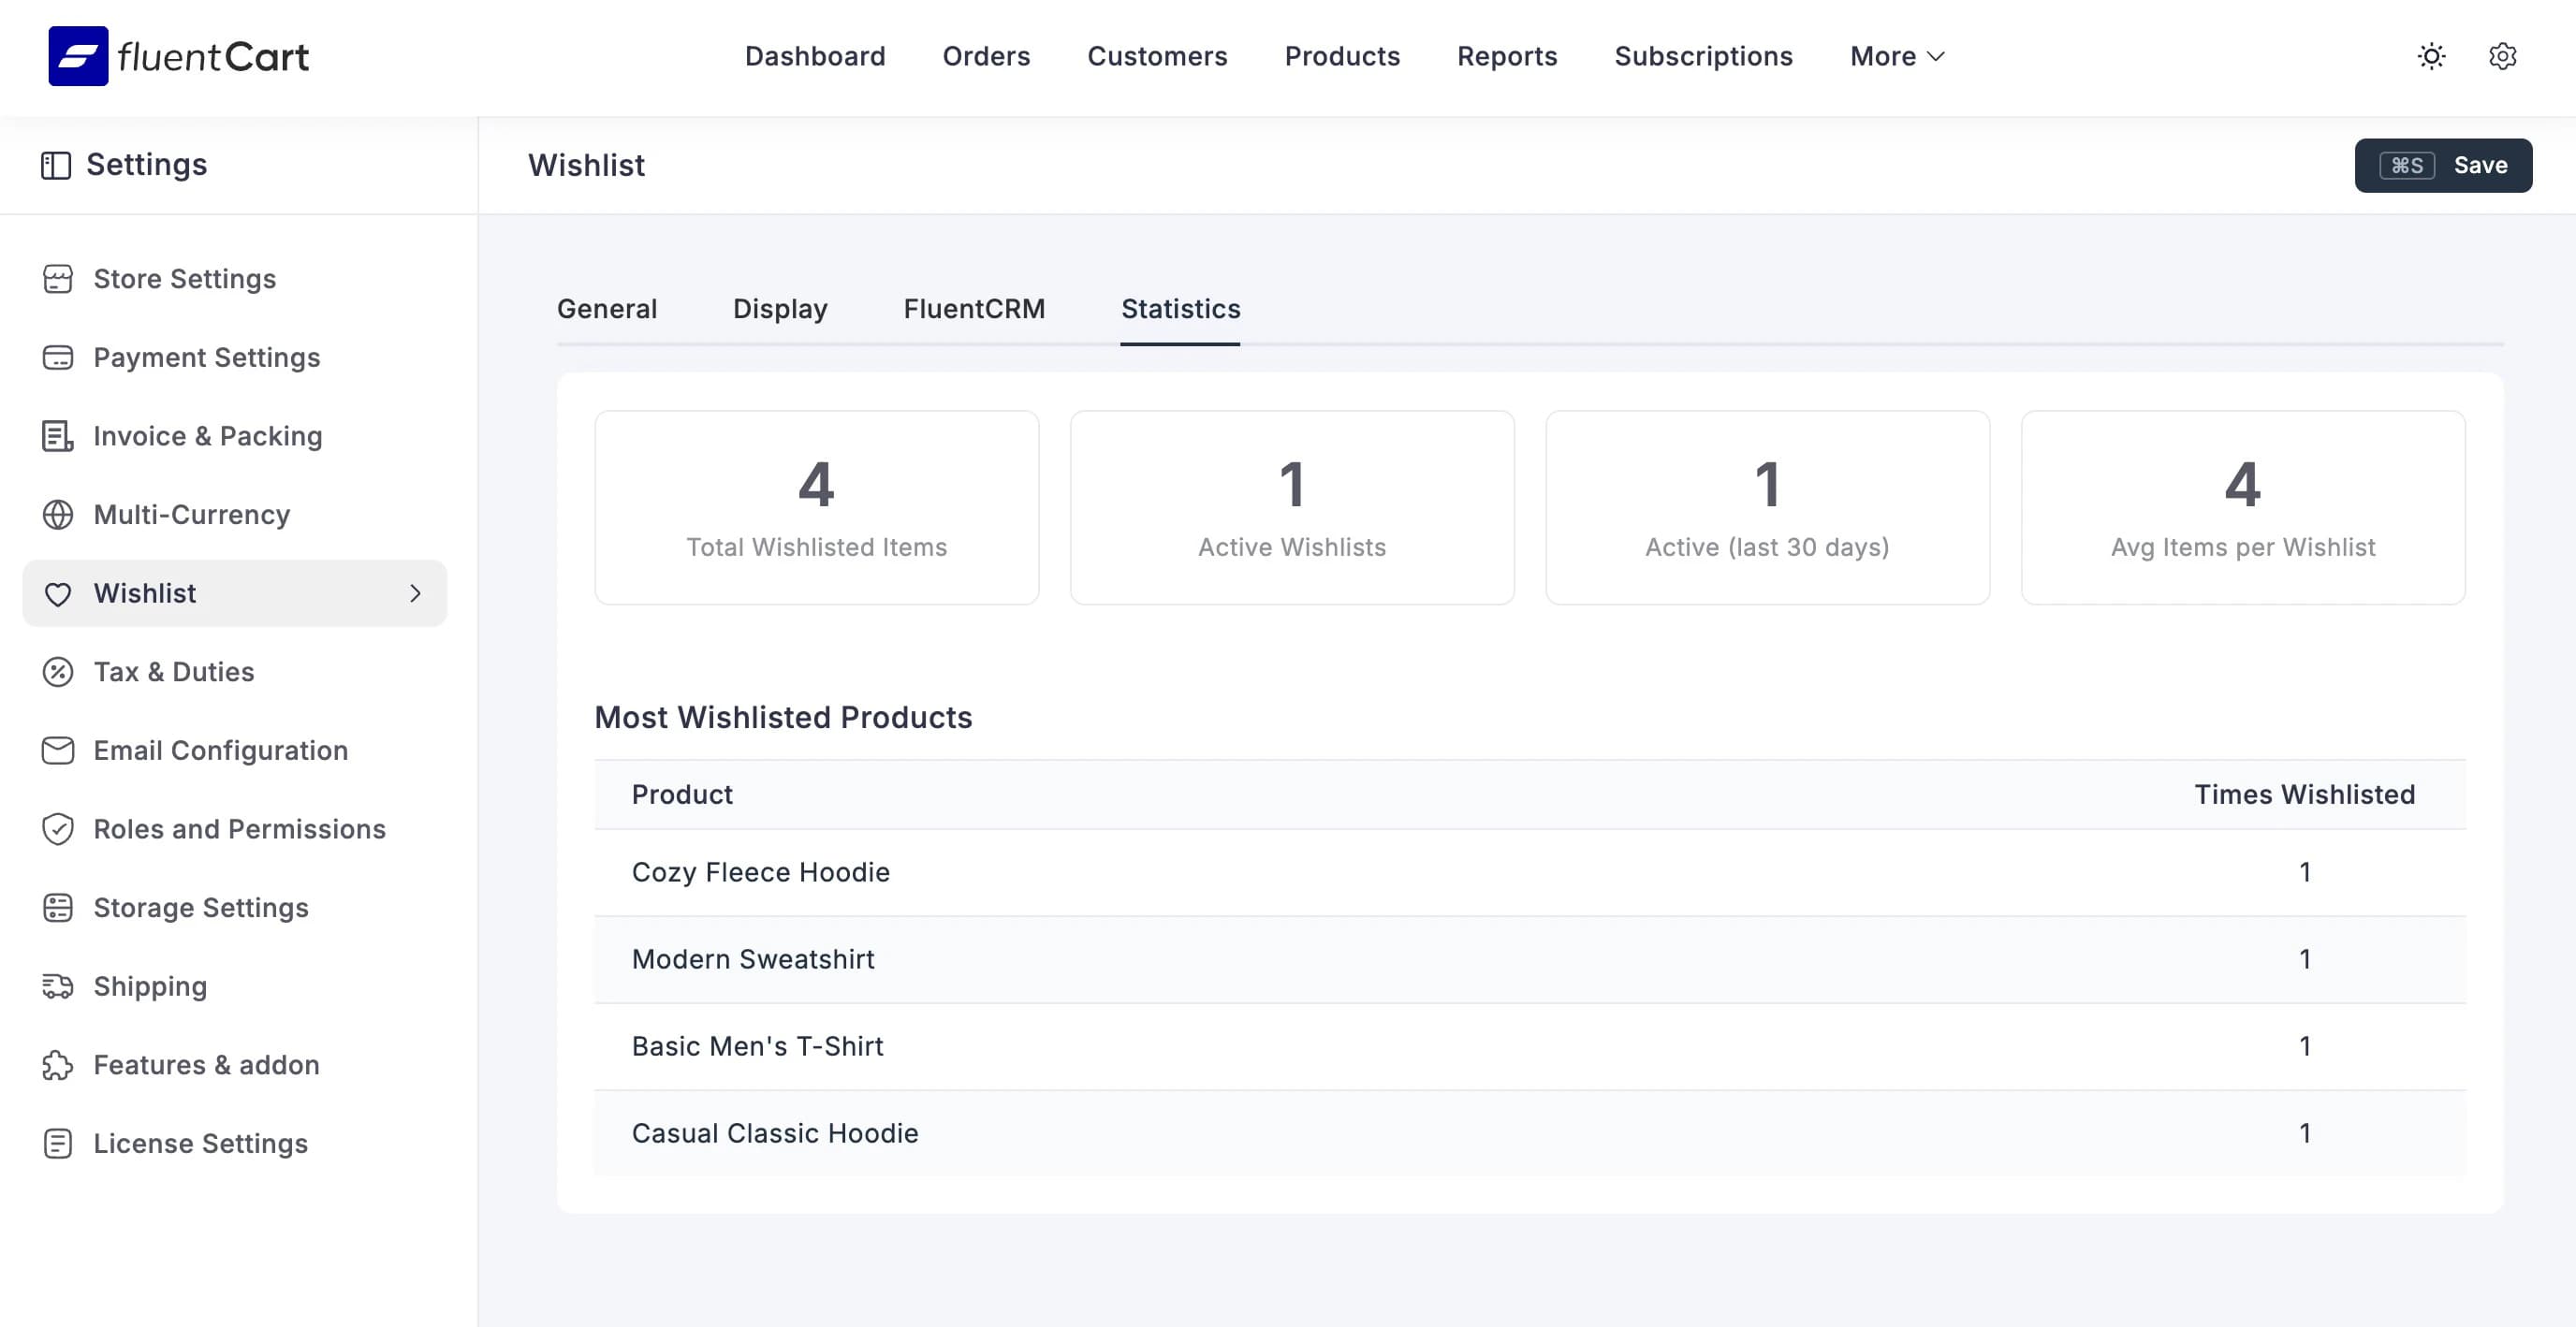
Four summary cards at the top:
| Metric | What It Shows |
|---|---|
| Total Wishlisted Items | How many individual items are saved across all wishlists |
| Active Wishlists | Number of wishlists that have at least one item |
| Active (last 30 days) | Wishlists that had activity in the past 30 days |
| Avg Items per Wishlist | Simple average — total items divided by active wishlists |
Most Wishlisted Products
Below the summary cards, a table shows your most-wishlisted products ranked by how many times they've been saved. Each row shows:
- Product name
- Times Wishlisted — total number of customers who saved this product
This is the goldmine. Products that get wishlisted a lot but don't sell well? Maybe the price is too high. Products that get wishlisted and sell well? Feature them more prominently. Products nobody wishlists? Maybe they need better photos.
Using the Data
The statistics tab is for quick glances. For deeper analysis and automation, pair it with the FluentCRM integration — tag contacts by wishlist activity, segment by product interest, and trigger campaigns based on what people want but haven't bought yet.